In an email to Republican House candidates, former Speaker Bill O'Brien boasted House Republicans “outperformed all other offices above us on the ballot” in the 2012 election.
“In the aggregate, of all the discrete New Hampshire Republican election campaigns in 2012 – House Republicans, Senate Republicans, Republican candidates for Congress and the Republican nominees for President and Governor – House Republicans achieved the highest percentage of votes,” he wrote.
New Hampshire’s multi-member districts and overlapping floterial districts make meaningful comparisons difficult. Simply adding up the total vote, as O'Brien suggests, doesn’t offer much insight. That count is skewed by votes from large multi-member districts in Republican-dominated towns in Hillsborough and Rockingham counties.
For example, compared to voters in single-member districts who cast a single vote for a House candidate, voters in Salem (Rockingham District 8) can cast up to nine votes, Derry residents (Rockingham District 6) can vote for 10 candidates and Hudson voters (Hillsborough District 37) can cast up to 11 House votes.
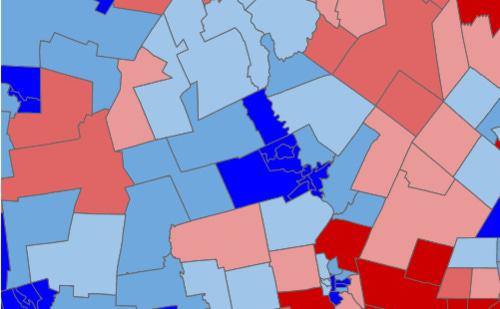
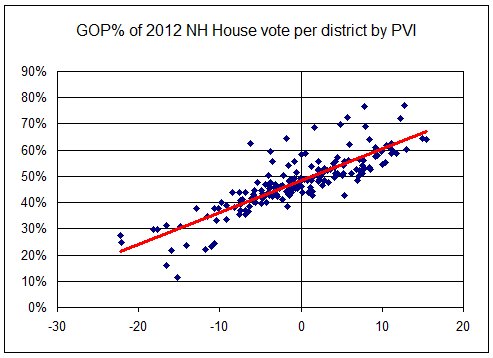
A more meaningful approach to analyze the House vote is to calculate the percentage of the total vote each party receives in each district. The map at the bottom of this post illustrates the results for the 2012 general election in the non-floterial districts. As you would expect, the results generally mirror the districts’ Partisan Voting Index (PVI). This scatter plot, which includes the results for each district in which both parties had a candidate on the ballot, charts the relationship.
To estimate the statewide partisan vote for House candidates, I averaged the two-party voting percentages from each district, weighted by the number of seats in the district. By this measure, House Republicans did, in fact, slightly outperform the Republican candidates for president and governor. Republican House candidates received a higher percentage of the vote than Romney in 111 of the 204 House districts and received 48.4% of the votes cast compared to 47.2% for Romney.
    2012 New Hampshire Two-Party Vote by Office

                      Republican   Democrat
    President           47.2%       52.8%
    US House            47.8%       52.2%
    Governor            43.8%       56.2%
    Exec Council        50.6%       49.4%
    NH Senate           49.0%       51.0%
    NH House (1)        48.4%       51.6%

    (1) Weighted avg of two-party % from each district
O'Brien would have you believe this vote was an indication that House Republicans’ efforts were so “appreciated by the people of New Hampshire” that a sizable number of Obama voters crossed over to vote for Republican House candidates. Or maybe Democratic voters, mobilized by the Obama campaign’s vaunted get-out-the-vote operation, cast less down-ballot votes than their Republican counterparts.


