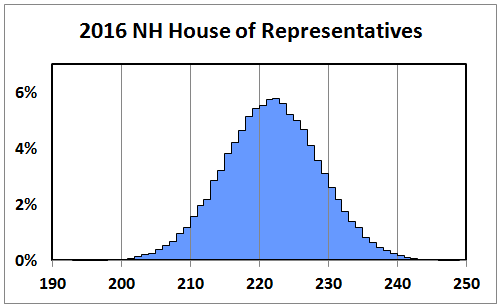
An early look at our 2016 forecast model for the New Hampshire House projects Democrats will regain control of the 400-seat chamber with a comfortable majority. If the election were held today, our model predicts Democrats would win 221 seats to 179 for Republicans.
As the partisan makeup of the House chamber historically mirrors national voting patterns, our model is based on just two variables: a partisan measure for each of the state’s 204 House districts and national presidential polling. (In non-presidential years, we use the results from generic congressional ballot surveys rather than presidential polls.) In 2014, this model projected Democrats would win 156 seats, just four seats off from the final count of 160.
Preconvention polling
So, what’s the likelihood of these results holding through November? The historical record on preconvention presidential polling is a mixed bag. In the last two elections, early July surveys have mirrored the actual voting results.
As documented in a Wikipedia compilation of historical polling by the Gallup Organization, Pres. Obama led Mitt Romney by four points in early July, 2012, the same margin by which he won the election in November. In 2008, he led John McCain by six points in early July and went on to win by seven.
Earlier results have been less predictive. John Kerry led George W. Bush by five points in July, 2004 only to lose by three in November; in 1988, Michael Dukakis saw a six point lead in early July reversed. He went on to lose to George H. W. Bush by seven percentage points.
Regardless, expect to see some volatility in polls over the next few weeks. Both parties typically receive a large (but temporary) bounce after their party convention. As Nate Silver notes, “Polling generally becomes more accurate as you get closer to Election Day. The exception to the rule is in the period immediately after the party conventions, when the polls can be a wild ride.”
Methodology
Our model does not attempt to judge the strengths or weaknesses of individual candidates or their campaigns and does not predict results for individual House races. Nor does it factor in unique characteristics of the national race that could result in the state’s voters diverging from historical patterns.
Using methodology similar to that used by the Cook Political Report, we’ve calculated a Partisan Voter Index (PVI) for each of the state’s 204 House districts. This measure compares how the district voted relative to the national average in the past two presidential elections.
(PVI is described by a letter that indicates whether the district leans Democratic or Republican and a number that describes the extent of the variance. For example, a D+2 district voted more Democratic than the nation as a whole by two percentage points.)
Based on results of previous House elections, we’ve calculated that, on average, a one percentage point increase in PVI increases (or decreases) the partisan win probability by roughly five percentage points. For example, our model calculated that a generic Democrat running against a generic Republican in 2012 had about a 40 percent win probability in a R+2 district compared to a 60 percent win probability in a D+2 district.
To determine a polling baseline, we aggregate polling averages from three analysts: Huffington Post, which has Clinton leading Trump by a 5.9 percent margin; Real Clear Politics, which gives Clinton a 4.5 percent advantage and Talking Points Memo, which has Clinton up by 4.1 percent. (Each of the aggregators use slightly different methodologies to calculate polling averages.)
For the final step, we run 100,000 simulations using a Monte Carlo method and aggregate the results. We’ll revisit and update this model in August after the two parties hold their conventions.


